9.10. Case Study HTML Dahab
9.10.1. Case Study 1
import pandas as pd
from matplotlib import pyplot as plt
pd.set_option('display.width', 300)
pd.set_option('display.max_columns', 15)
pd.set_option('display.max_rows', 100)
pd.set_option('display.min_rows', 100)
pd.set_option('display.max_seq_items', 100)
# DATA = 'https://en.wikipedia.org/wiki/Dahab'
DATA = 'https://python3.info/_static/html-dahab-2.html'
tables = pd.read_html(DATA)
sea = tables[2]
air = (
tables[1]
.droplevel(0, axis='columns')
.iloc[:-2]
.replace({'Month': {
'Average high °C (°F)': 'temperature high',
'Daily mean °C (°F)': 'temperature mean',
'Average low °C (°F)': 'temperature low',
'Average precipitation mm (inches)': 'precipitation average',
'Average rainy days': 'precipitation days',
'Mean daily sunshine hours': 'sunshine hours'}})
.drop(columns=['Year'])
.set_index('Month')
.replace(r' \(.+\)', '', regex=True)
.astype('float16')
.convert_dtypes()
.round(1)
)
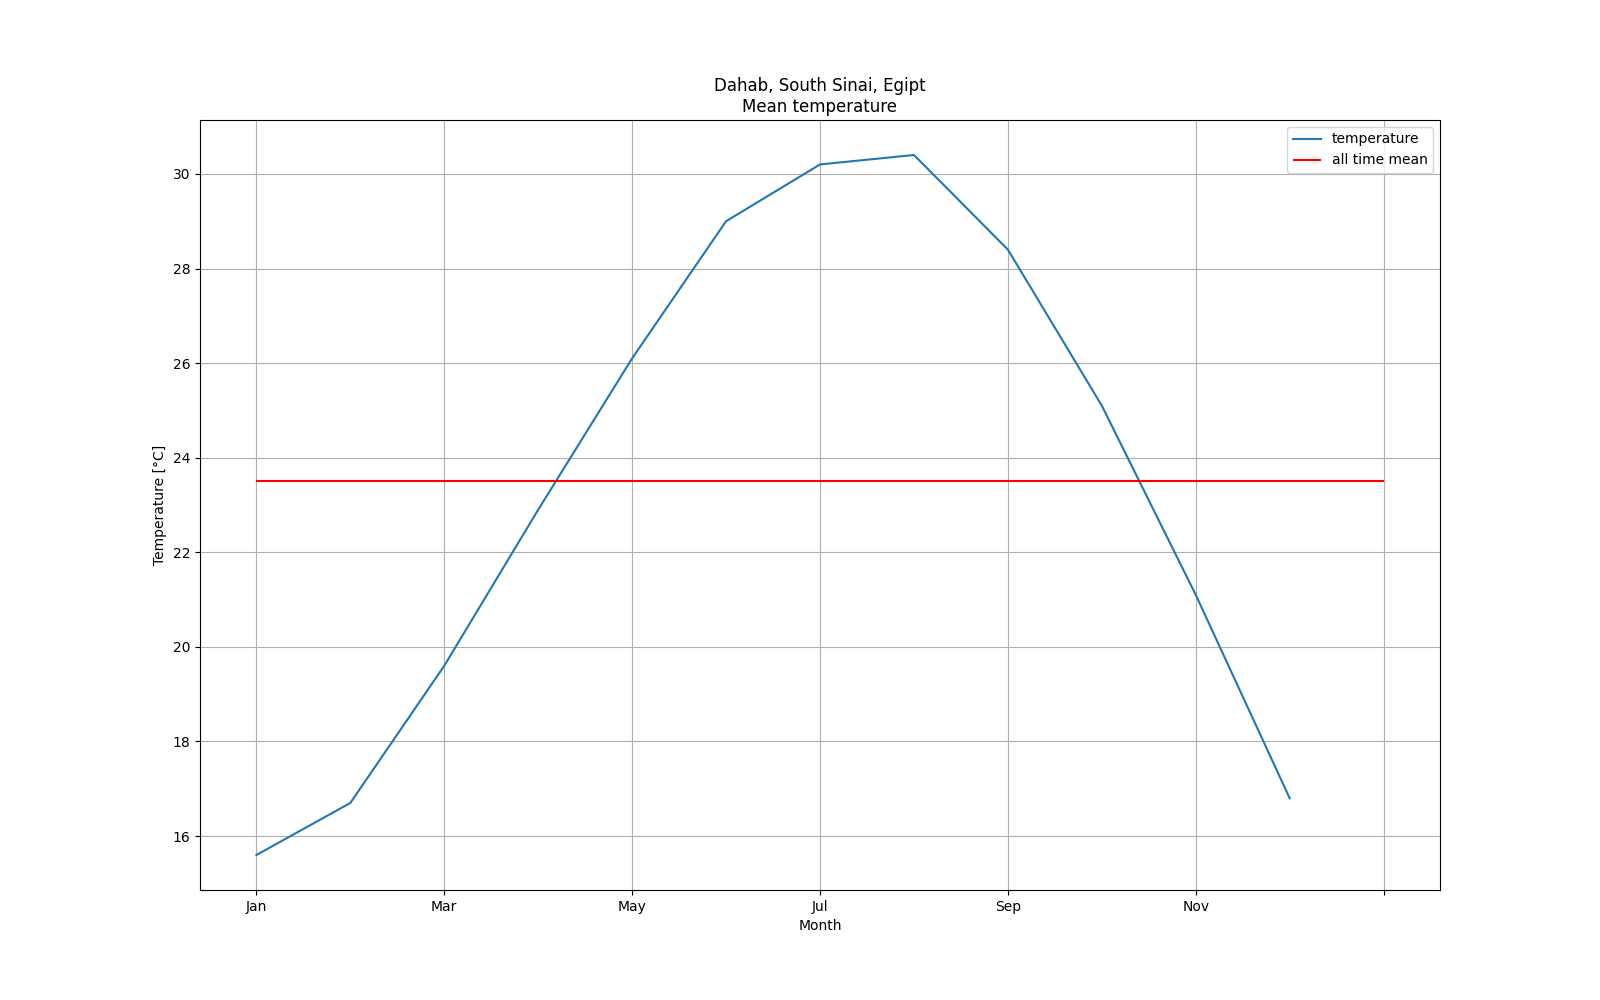
# Daily mean temperature
mean_per_month = air.loc['temperature mean', :]
mean = mean_per_month.mean().round(1) # 23.5
plot = (
mean_per_month
.plot(
kind='line',
title='Dahab, South Sinai, Egipt\nMean temperature',
xlabel='Month',
ylabel='Temperature [°C]',
grid=True,
figsize=(16,10),
label='temperature'))
plt.hlines(
y=mean,
xmin=0,
xmax=mean_per_month.size,
color='red',
label='all time mean')
plt.legend()
# plt.show()
9.10.2. Case Study 2
# %%
import pandas as pd
from matplotlib import pyplot as plt
# %%
# DATA = 'https://en.wikipedia.org/wiki/Dahab'
DATA = 'https://python3.info/_static/html-dahab-2.html'
dfs = pd.read_html(DATA)
# %%
air = (
dfs[1]
.iloc[1]
.droplevel(0)
.astype('string')
.str.extract(r'(\d{1,2}\.\d{1})')
.drop(['Year', 'Month'], axis='rows')
.astype('float')
.rename(columns={0:'air'})
.convert_dtypes()
)
# %%
sea = (
dfs[2]
.transpose()
.astype('string')
.loc[:, 0]
.str.extract(r'(\d{1,2})')
.astype('float')
.rename(columns={0:'sea'})
.convert_dtypes()
)
# %%
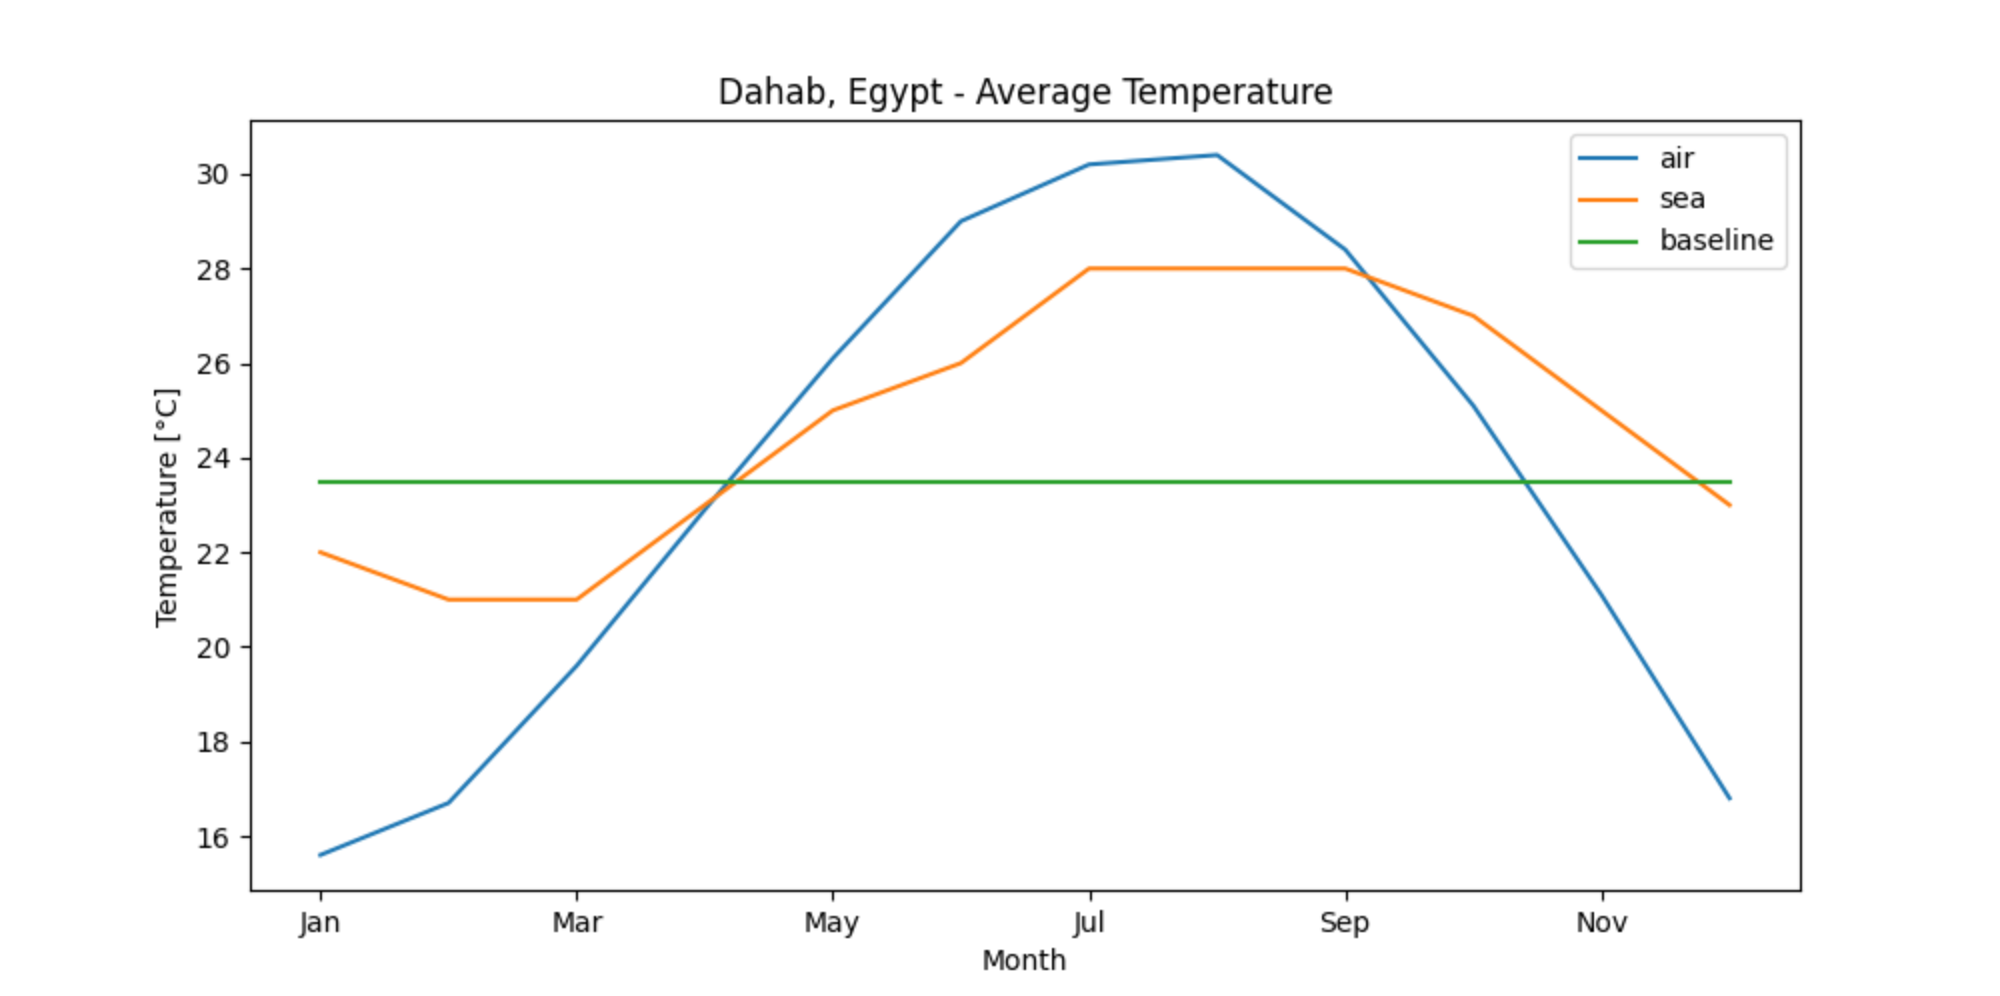
temperature = pd.concat([air, sea], axis='columns')
# %%
plot_average_temperature = (
temperature
.assign(baseline=lambda df: df['air'].mean())
.plot(
kind='line',
title='Dahab, Egypt - Average Temperature',
xlabel='Month',
ylabel='Temperature [°C]',
figsize=(10, 5),
)
)
plt.show()
# %%
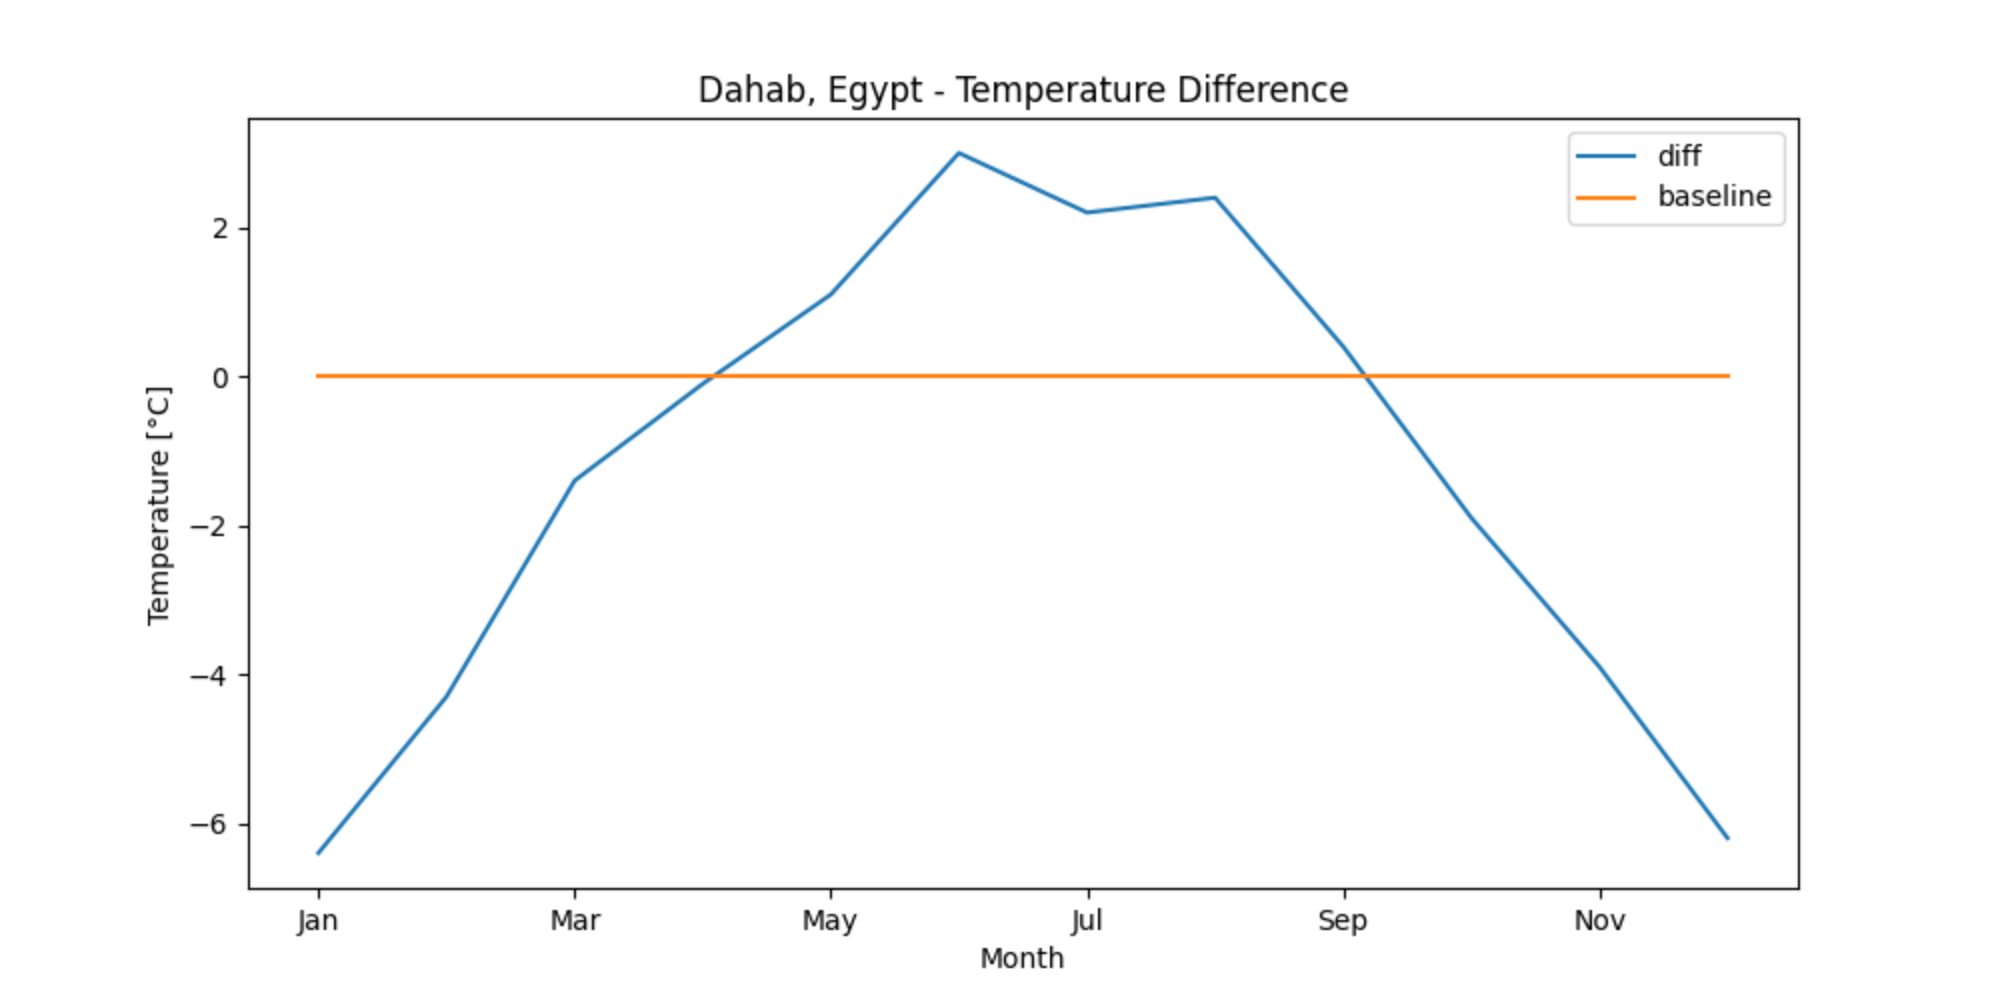
plot_difference = (
temperature
.assign(diff=lambda df: df['air'] - df['sea'])
.assign(baseline=0)
.loc[:, ['diff', 'baseline']]
.plot(
kind='line',
title='Dahab, Egypt - Temperature Difference',
xlabel='Month',
ylabel='Temperature [°C]',
figsize=(10, 5),
)
)
plt.show()